normalian blog

Let's talk about Microsoft Azure, ASP.NET and Java!

How to get started with EA Portal for Microsoft Azure

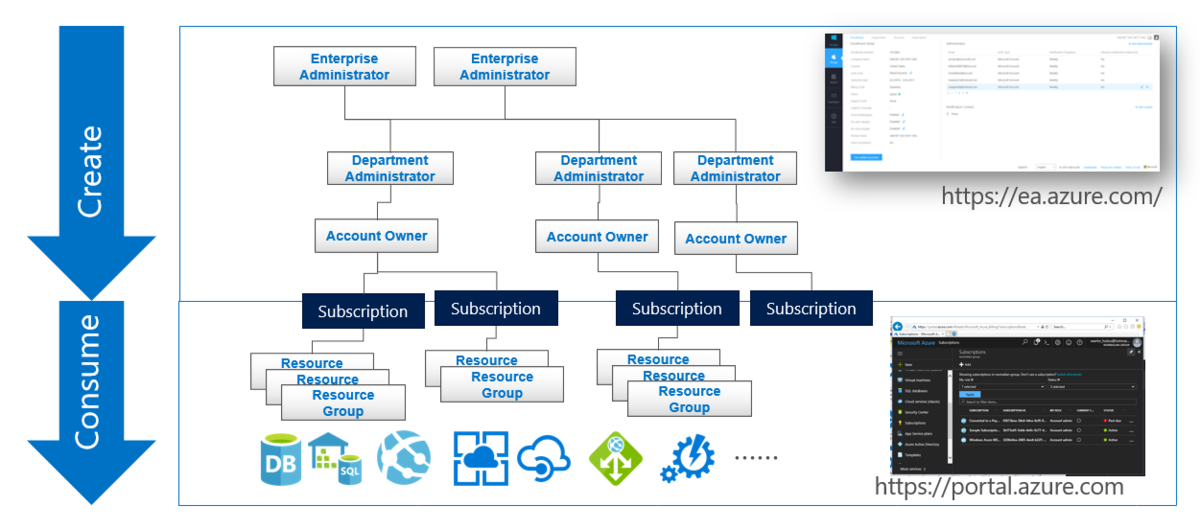
I believe most of Azure developers aren't familiar with EA Portal because only Enterprise Agreement contractor can utilize the portal. usage of this EA Portal is completely different from Azure Portal which all Azure developers are familiar like below.
f:id:waritohutsu:20190524095659p:plain

  • EA Portal is utilized to create Azure subscriptions which charge from your EA contract
  • Azure Portal is utilized to create Azure resources and consume from EA contract

As you can imagine, billing owners should use EA Portal and developers should use Azure Portal. But it sometimes difficult how to take knowledge to utilize EA Portal.

How to arrange onboarding meeting for EA Portal

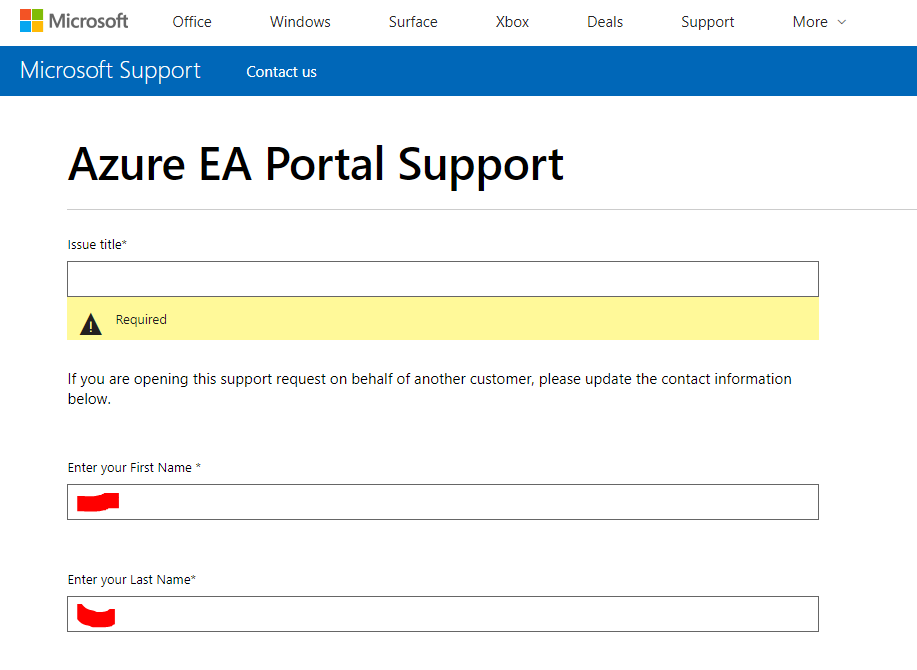
Fortunately, Microsoft offers to arrange onboarding meeting with experts for EA Portal. Reach out Azure EA Portal Support and you can find a page like below.
f:id:waritohutsu:20190523094911p:plain
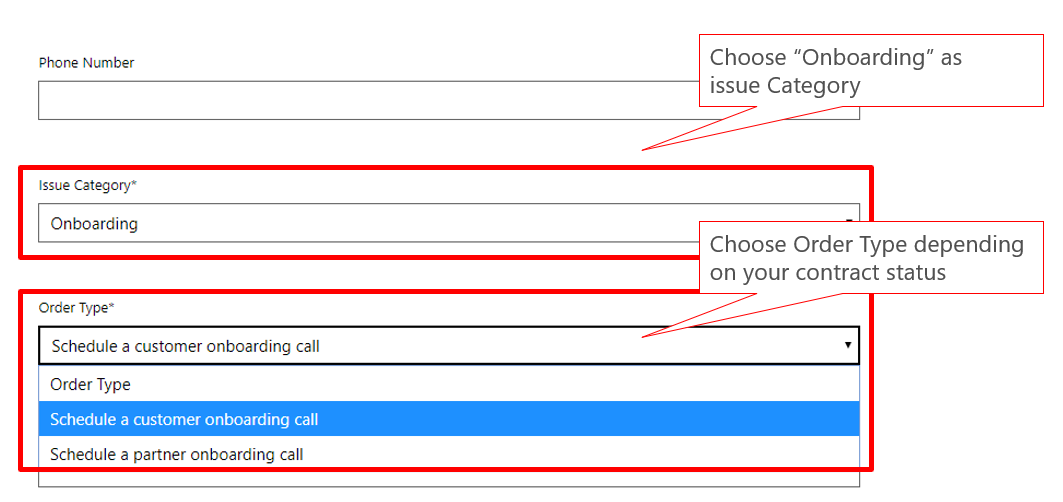
You can find "issue category" bottom of it. Choose "Onboarding" like below to schedule EA Portal onboarding meeting with the expert.
f:id:waritohutsu:20190523095013p:plain
After choosing them, you need to fill out some details of your status. Now, you can have a great meeting to earn deep knowledge for EA Portal. This onboarding meeting is no charge and I recommend to utilize this as possible.

How to utilize monitoring for container apps on Service Fabric clusters with Log Analytics - part 3: find CPU usage spikes

You can learn how to CPU usage spikesfrom your Log Analytics, but you need to peruse an article below to follow this post.
normalian.hatenablog.com

Prerequirement

You need to setup components below. In this post, we execute performance test to your Service Fabric cluster applications using by Application Insights.

  • Service Fabric cluster with Windows nodes
  • Log Analytics and associate to your Service Fabric cluster
  • Windows Container applications and deploy it into your Service Fabric cluster
  • Application Insights

Execute "Performance Testing" with your Application Insights

I believe as you know, Application Insights offers "Performance Testing" feature. We are no longer needed to setup multiple devices and load test applications such like JMeter.
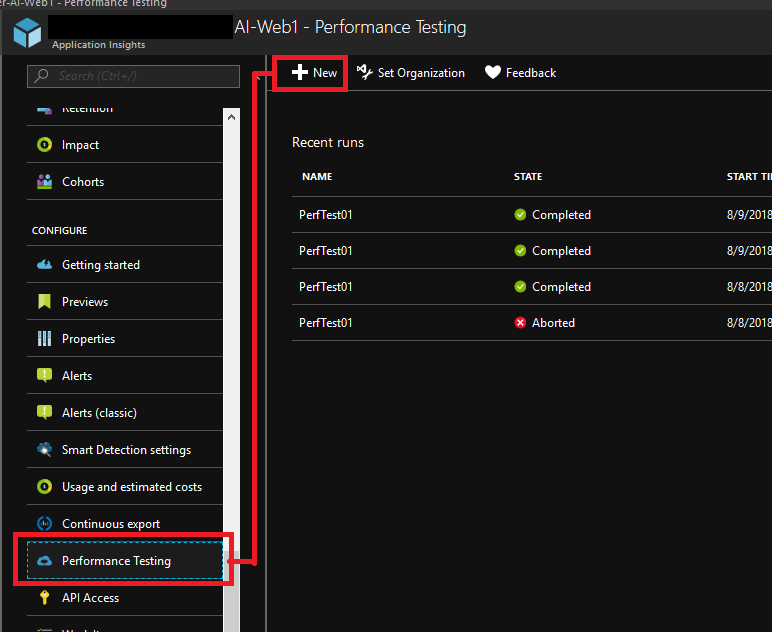
Open your Application Insights, choose "Performance Testing" item among left side menus and click "New" item to create new performance test.
f:id:waritohutsu:20180811034948p:plain

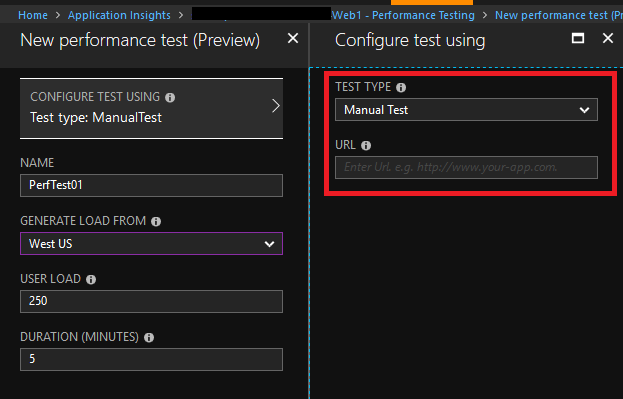
Input an endpoint of your Service Fabric application following a picture below. Now, you can execute your performance test.
f:id:waritohutsu:20180811035207p:plain

Refer to Test your Azure web app performance under load from the Azure portal | Microsoft Docs how to setup your performance test in details.

Clarify bottlenecks of your Service Fabric applications

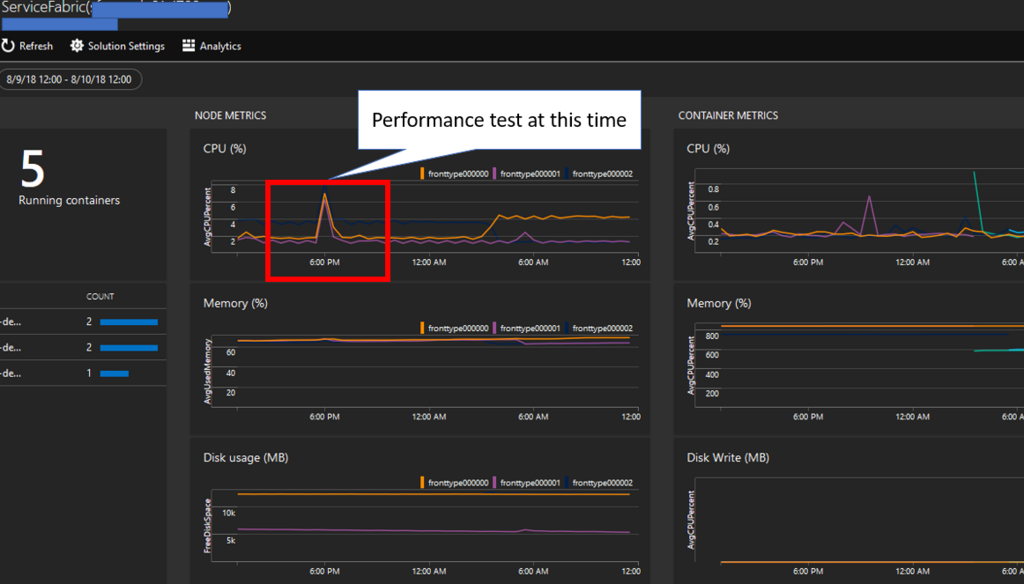
Watch your Log Analytics solution to confirm your Service Fabric cluster metrics in about an hour after your performance test. You probably confirm CPU usage spike on your NODE METRICS like below.
f:id:waritohutsu:20180811040548p:plain

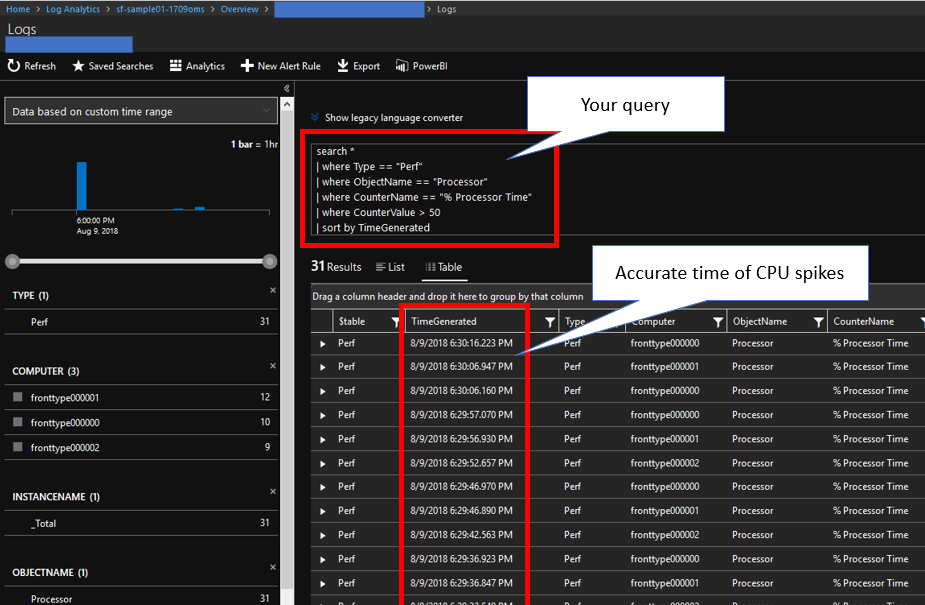
Next, execute a query below to identify know exact time of the CPU usage spikes of NODE METRICS not container applications.

search *
| where Type == "Perf"
| where ObjectName == "Processor"
| where CounterName == "% Processor Time"
| where CounterValue > 50
| sort by TimeGenerated

f:id:waritohutsu:20180811041017p:plain

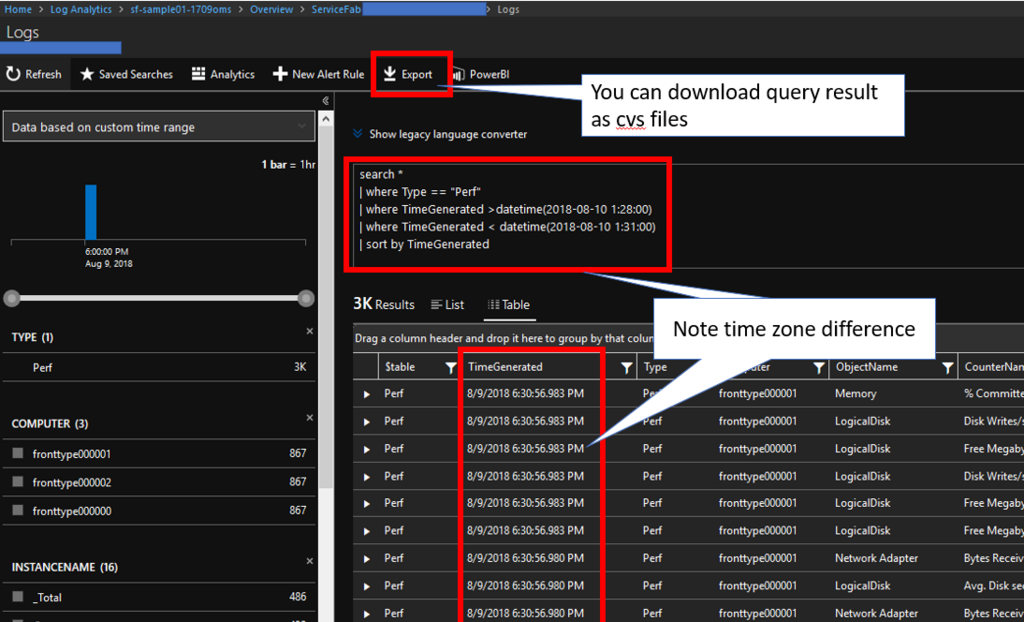
The spikes are around 8/9/2018 6:30PM in PST time zone, but you need to retrieve Log Analytics data with UTC time zone in your query even display time zone is yours. Execute query like below to retrieve all metrics around the time.

search *
| where Type == "Perf"
| where TimeGenerated >datetime(2018-08-10 1:28:00) 
| where TimeGenerated < datetime(2018-08-10 1:31:00)
| sort by TimeGenerated 

f:id:waritohutsu:20180811042635p:plain

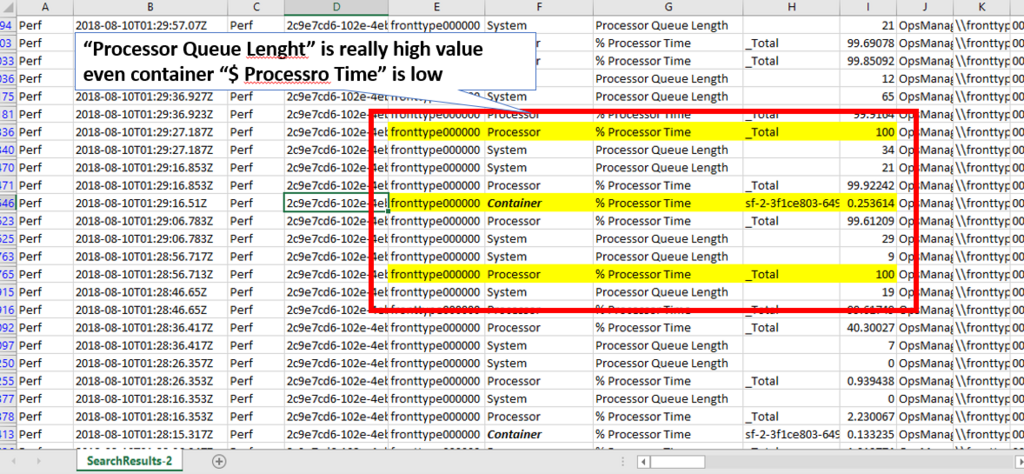
And you can download result of the query and analyze it with Excel and other client side tools. At this time, we can find "Processor Queue Lengh" are high like below.
f:id:waritohutsu:20180811050315p:plain

You can dig into further more to use this awesome tools if you will face some performance issues.

How to utilize monitoring for container apps on Service Fabric clusters with Log Analytics - part 2: log types

Refer to an article below before following this post to setup Log Analytics for Service Fabric clusters.
normalian.hatenablog.com
You can learn how to execute simple queries on Log Analytics to retrieve Service Fabric clusters metrics.

I believe you have already setup your Service Fabric cluster with your container apps and Log Analytics. Open your Log Analytics and choose "Log Search" item. Next, execute "search *" command like below then you can take all types of logs stored into your Log Analytics.
f:id:waritohutsu:20180809081445p:plain

You can find several types of logs such like "Perf", "ContainerImageInventory", "ContainerInventory", "Heartbeat" and "Usage". According to Container Monitoring solution in Azure Log Analytics | Microsoft Docs, we can understand which metrics we can take. Next, let's dig into each log types exept for Usage, because the type is used for Log Analytics usage.

"Perf" type

In this type, you can retrieve Processor Time, Memory Usage, network usage, Disk usage including container applications.
At first, you retrieve Service Fabric cluster nodes metrics specifying ObjectName as necessary metrics like below.

search *| where Type == "Perf“
| where ObjectName == "Processor“
| where CounterName == "% Processor Time“
| where CounterValue > 25

You can find query result like below.
f:id:waritohutsu:20180809083123p:plain

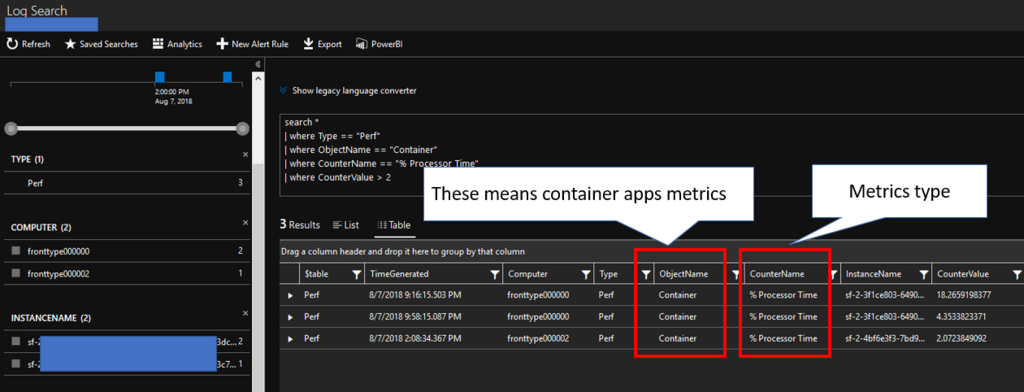
next, retrieve container apps metrics on Service Fabric cluster by executing log search query below and you can retrieve container apps metrics.

search *
| where Type == "Perf“
| where ObjectName == "Container“
| where CounterName == "% Processor Time“
| where CounterValue > 2

Note the query is specified "Container“ as ObjectName and CounterName which metrics is needed.
f:id:waritohutsu:20180809083246p:plain

We can really dig into this log type in lots of perspectives. I will follow that in future.

"ContainerImageInventory" type

You can retrieve which repositories, images, tags, image sizes and nodes are used to deploy your container apps like below.
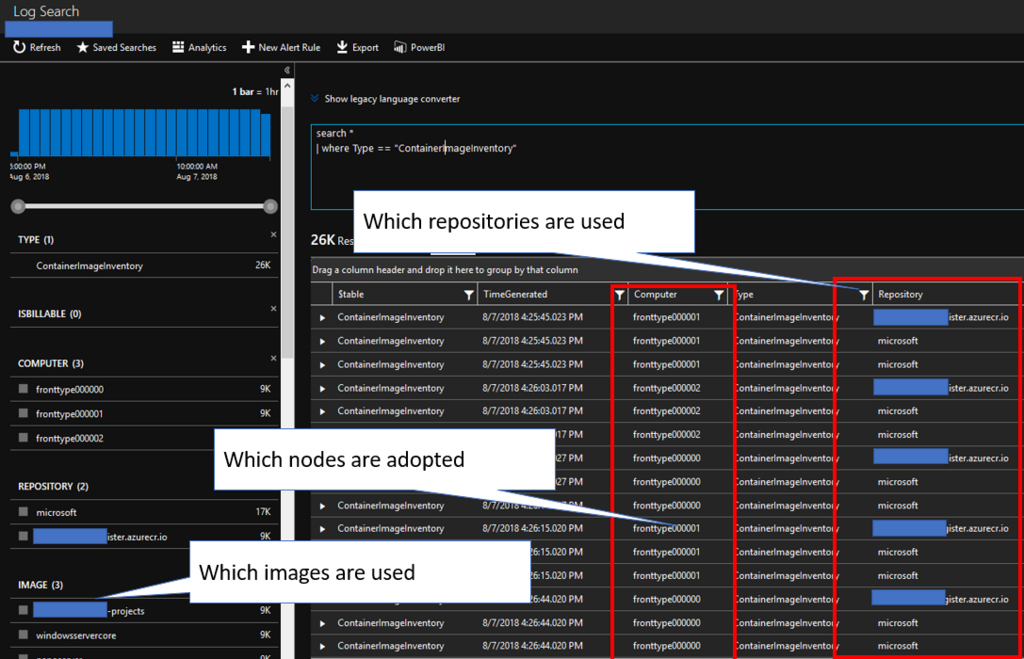
f:id:waritohutsu:20180809084040p:plain

"ContainerInventory" type

In this type, you can retrieve TimeGenerated, Computer, container name, ContainerHostname, Image, ImageTag, ContainerState, ExitCode, EnvironmentVar, Command, CreatedTime, StartedTime, FinishedTime, SourceSystem, ContainerID, and ImageID like below.
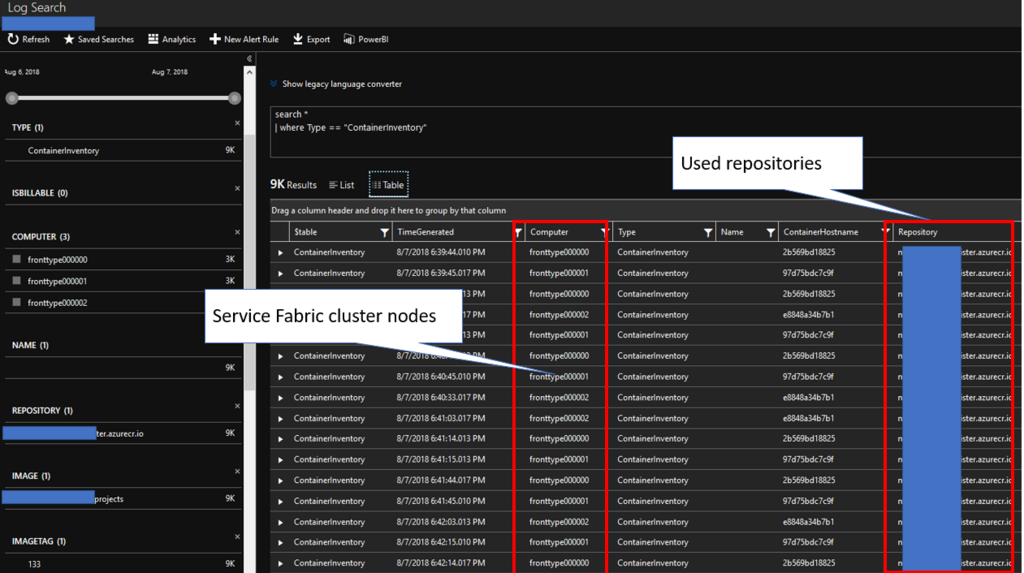
f:id:waritohutsu:20180809084656p:plain

You can monitor container apps life cycle using this log type using ContainerState, TimeGenerated, CreatedTime, StartedTime and FinishedTime like below.
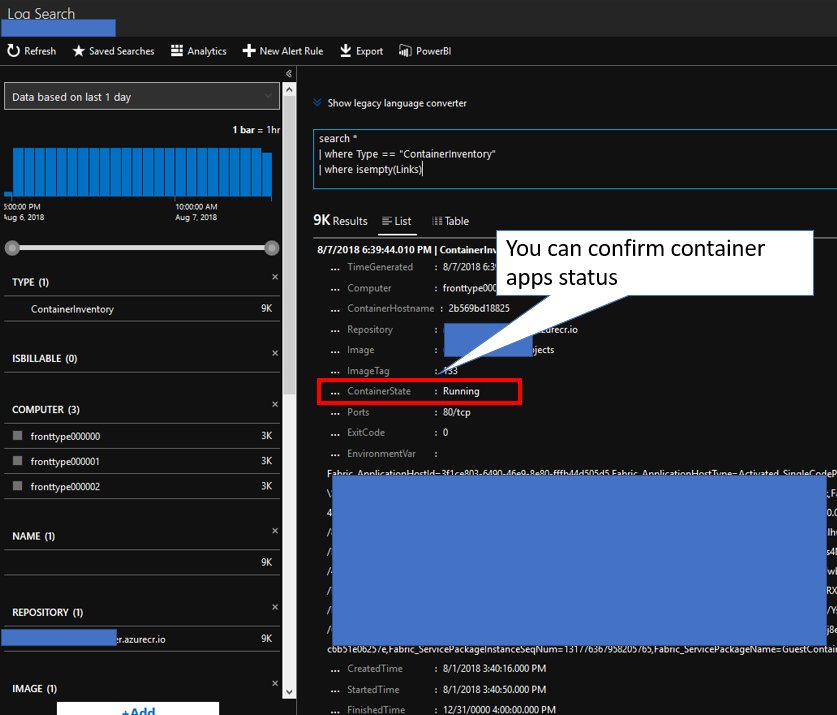
f:id:waritohutsu:20180809084903p:plain

How to utilize monitoring for container apps on Service Fabric clusters with Log Analytics - part 1: setup

You can learn how to setup Log Analytics for your Windows container apps on Service Fabric clusters. You need to follow steps below.

  • Setup up Service Fabric cluster with Diagnostics "On"
  • Create an Log Analytics workspace and add "Service Fabric Analytics" into your Log Analytics workspace
  • Add "Container Monitoring Solution" into your Log Analytics workspace
  • Enable "Windows Performance Counters" in your Log Analytics workspace
  • Configure a Log Analytics workspace to associate Azure Storage stored Service Fabric logs
  • Add the OMS agent extension
  • Watch metrics on Log Analytics workspace

According to an article below, you have to setup "Service Fabric Analytics" and "Container Monitoring Solution" respectively right now. It will be integrated in future.

Setup up Service Fabric cluster with Diagnostics "On"

Refer to an article below.
normalian.hatenablog.com
And keep in mind that you should enable "Diagnostics" as "On" like below.
f:id:waritohutsu:20180802120914p:plain

Create an Log Analytics workspace and add "Service Fabric Analytics" into your Log Analytics workspace

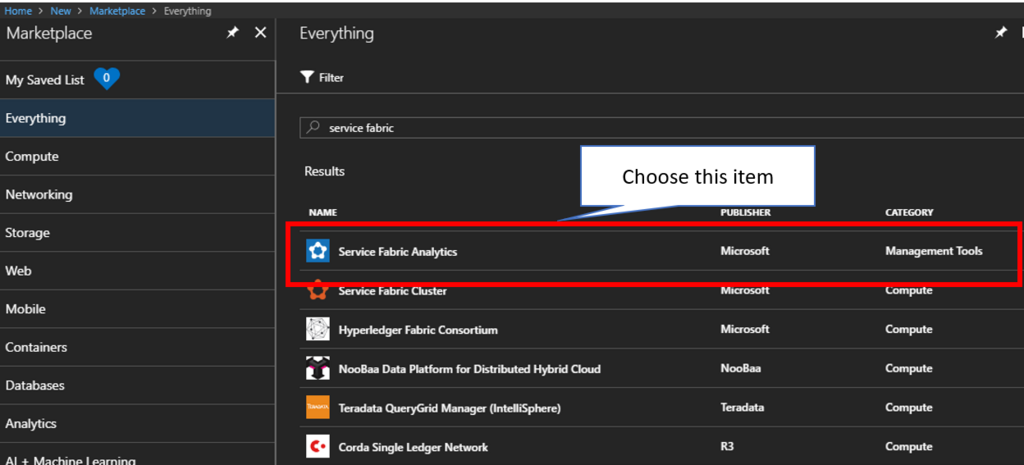
It's needed to monitor Service Fabric container apps by creating "Service Fabric Analytics". Search "service fabric" in Marketpalce on Azure Portal like below.
f:id:waritohutsu:20180802120931p:plain
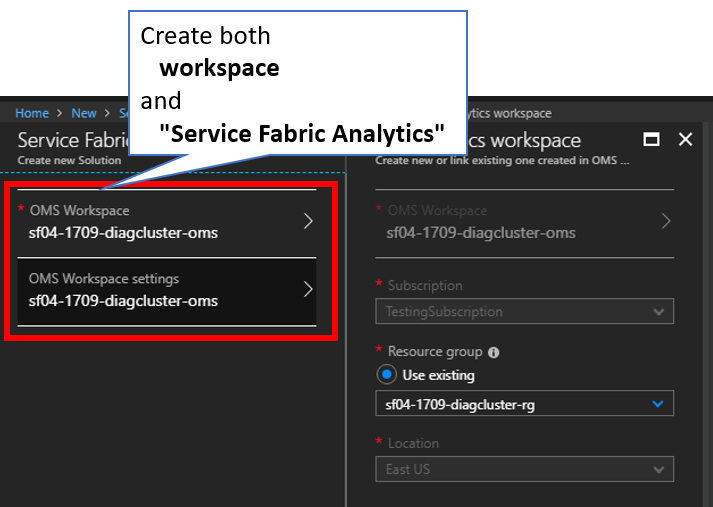
And create Log Analytics workspace and "Service Fabric Analytics" like below.
f:id:waritohutsu:20180802120948p:plain

Add "Container Monitoring Solution" into your Log Analytics workspace

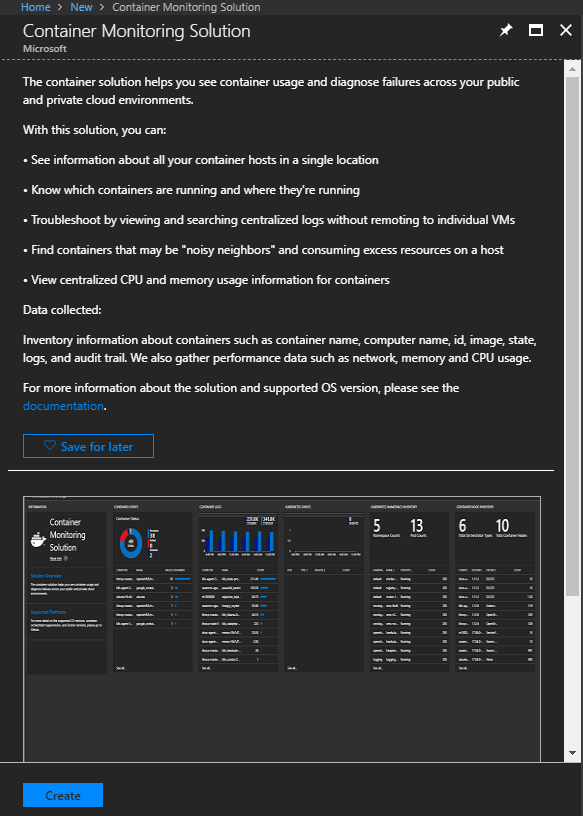
Search "Container Monitor" in Marketpalce on Azure Portal and find "Container Monitoring Solution" like below.
f:id:waritohutsu:20180802121755p:plain
Create "Container Monitoring Solution" into your Log Analytics workspace.

Enable "Windows Performance Counters" in your Log Analytics workspace

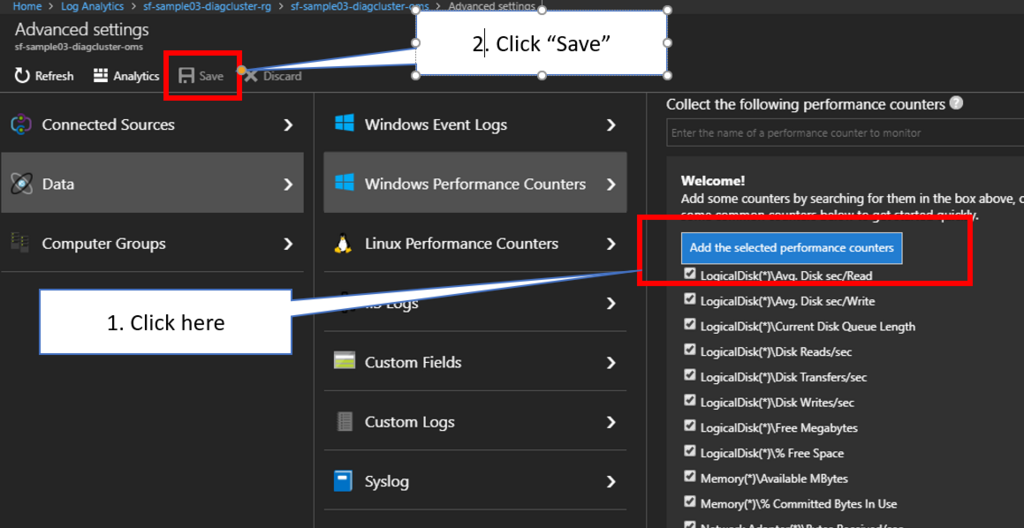
After completion to create Log Analytics workspace, go to "Advanced setting -> Data -> Windows Performance Counters" and enable like below.
f:id:waritohutsu:20180802120959p:plain
Don't forget to click "Save" after changing settings of your workspace.

Configure a Log Analytics workspace to associate Azure Storage stored Service Fabric logs

Refer to Assess Service Fabric applications with Azure Log Analytics using PowerShell | Microsoft Docs and execute "Configure Log Analytics to collect and view Service Fabric logs
" PowerShell scripts interactively.
You can find two Azure Storage accounts in your Log Analytics workspace like below.
f:id:waritohutsu:20180802121529p:plain

Add the OMS agent extension

At first, go to your Log Analytics workspace, choose "Advanced settings -> Connected Sources -> Windows Servers" and pick up “WORKSPACE ID” and “PRIMARY KEY” like below.
f:id:waritohutsu:20180802122345p:plain
After that, execute Azure-cli comand below to add oms agent into your VMSS of Service Fabric cluster.

az vmss extension set --name MicrosoftMonitoringAgent --publisher Microsoft.EnterpriseCloud.Monitoring --resource-group <nameOfResourceGroup> --vmss-name <nameOfNodeType> --settings "{'workspaceId':'<Log AnalyticsworkspaceId>'}" --protected-settings "{'workspaceKey':'<Log AnalyticsworkspaceKey>'}"

You can confirm to find three extensions by executing PowerShell commands like below.

PS C:\Users\warit> $resourceGroupName = "your resource group name"
PS C:\Users\warit> $resourceName ="your node type name and it equals to your VMSS name"
PS C:\Users\warit> $virtualMachineScaleSet = Get-AzureRmVmss -ResourceGroupName $resourceGroupName -VMScaleSetName $resourceName
PS C:\Users\warit> $virtualMachineScaleSet.VirtualMachineProfile.ExtensionProfile.Extensions

Name                    : nodetype_ServiceFabricNode
ForceUpdateTag          : 
Publisher               : Microsoft.Azure.ServiceFabric
Type                    : ServiceFabricNode
TypeHandlerVersion      : 1.0
AutoUpgradeMinorVersion : True
Settings                : {clusterEndpoint, nodeTypeRef, dataPath, durabilityLevel...}
ProtectedSettings       : 
ProvisioningState       : 
Id                      : 

Name                    : VMDiagnosticsVmExt_vmNodeType0Name
ForceUpdateTag          : 
Publisher               : Microsoft.Azure.Diagnostics
Type                    : IaaSDiagnostics
TypeHandlerVersion      : 1.5
AutoUpgradeMinorVersion : True
Settings                : {WadCfg, StorageAccount}
ProtectedSettings       : 
ProvisioningState       : 
Id                      : 

Name                    : MicrosoftMonitoringAgent
ForceUpdateTag          : 
Publisher               : Microsoft.EnterpriseCloud.Monitoring
Type                    : MicrosoftMonitoringAgent
TypeHandlerVersion      : 1.0
AutoUpgradeMinorVersion : True
Settings                : {workspaceId}
ProtectedSettings       : 
ProvisioningState       : 
Id                      : 

Watch metrics on Log Analytics workspace

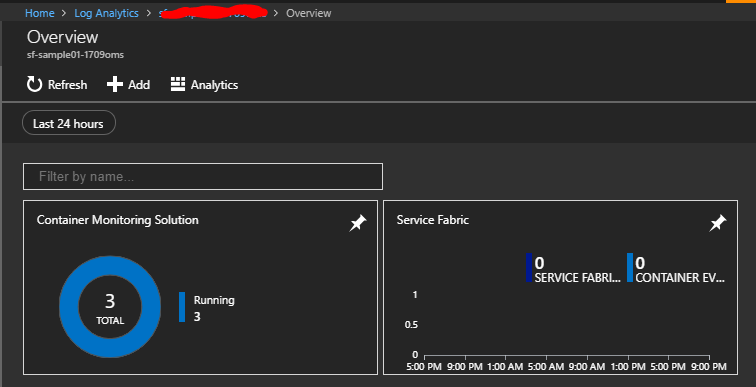
You should wait about 10 minutes or later to store metrics into your Log Analytics workspace. Go to "workspace summary" on your Log Analytics workspace and you can find two items like below.
f:id:waritohutsu:20180802124054p:plain
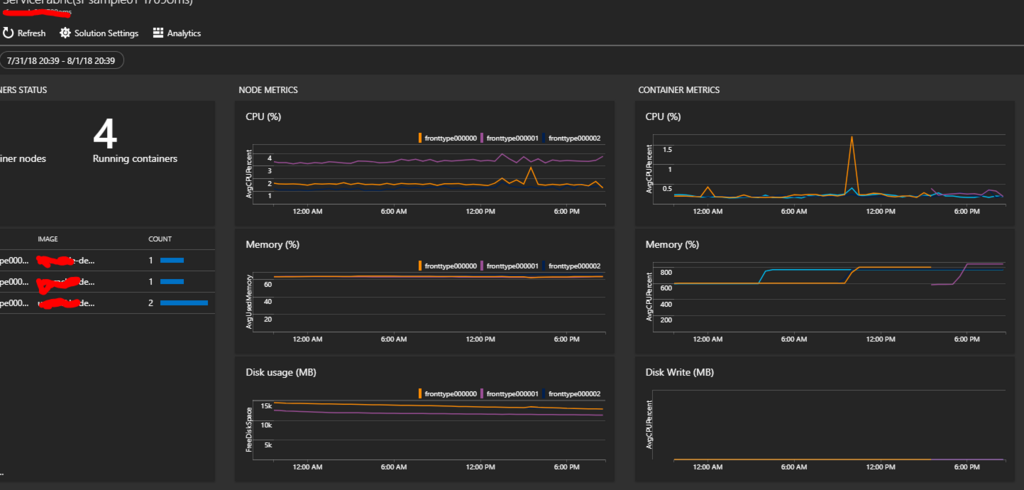
Choose "Service Fabric" and you can find CPU/Memory/Disk usage both host nodes and container metrics like below.
f:id:waritohutsu:20180802124216p:plain

How to dig into API Management performance with Application Insights

As you know, Azure API Management is integrated with API management like below.
docs.microsoft.com
This article describe how to setup the integration and utilize the feature.

Create your Application Insights

You need to create Application Insights to associate with API management like below. Note you need to choose "General" as Application Type.
f:id:waritohutsu:20180726041037p:plain

Associate your Application Insights with API Management and configure it

Choose "Application Insight" item from left side menus of API Management and associate it like below.
f:id:waritohutsu:20180726041210p:plain

Next, choose "APIs" item from left side menus of API Management and click "Settings" tab. Change "Sampling" and "First bytes of body(max 1024)" after enabling Application Insights like below.
f:id:waritohutsu:20180726041520p:plain
Change "Sampling" value as 100 to pick up all request into Application Insight. And change "First bytes of body(max 1024)" as 1024 or your demand if you need to confirm request body.

How to confirm in Application Insights

At first, you can use "Live Metrics Stream". This shows Request duration, CPU usage, committed memory and others like below.
f:id:waritohutsu:20180726042009p:plain

Second, you can dig into from "performance" tab like below. You can confirm who many requests, how request duration and others. And you can also dig into requests to confirm their dependencies.
f:id:waritohutsu:20180726042125p:plain
f:id:waritohutsu:20180726042134p:plain

Configuration tips when you need to upgrade Service Fabric cluster applications

Service Fabric is one of components to offer Microservice architecture and it's also used with CI/CD tools such like VSTS. In this post, you can learn tips to construct Microservice architecture CI/CD pipeline.

Error #1 "You must first remove the existing application before a new application can be deployed or provide a new name for the application."

You will get this error when you try to upgrade your Service Fabric applications as latest version. Here is error message within VSTS release process.

2018-07-24T23:02:08.4239940Z Imported cluster client certificate with thumbprint 'XXXXXXXXXXXXXXXXXXXXXXXXXXXXXXX'.
2018-07-24T23:02:27.2235680Z Successfully connected to cluster.
2018-07-24T23:02:27.2624467Z Searching for path: D:\a\r1\a
2018-07-24T23:02:27.3693528Z No items were found with search pattern D:\a\r1\a.
2018-07-24T23:02:35.2334317Z ##[error]An application with name 'fabric:/MySFASPAppType' already exists, its type is 'MySFASPAppType' and version is '1.0.0.20180724.1'. You must first remove the existing application before a new application can be deployed or provide a new name for the application.
2018-07-24T23:02:35.8774898Z ##[section]Finishing: Deploy Service Fabric Application

You need to configure upgrade option for Service Fabric cluster with Visual Studio like below. You can come up this dialog by right click and choose "Publish".
f:id:waritohutsu:20180725161131p:plain

The configuration will be reflected into "your Service Fabric project name"\PublishProfiles\Cloud.xml like below.

<?xml version="1.0" encoding="utf-8"?>
<PublishProfile xmlns="http://schemas.microsoft.com/2015/05/fabrictools">
  <ClusterConnectionParameters ConnectionEndpoint="" />
  <ApplicationParameterFile Path="..\ApplicationParameters\Cloud.xml" />
  <CopyPackageParameters CompressPackage="true" />
  <UpgradeDeployment Mode="UnmonitoredAuto" Enabled="true">
    <Parameters UpgradeReplicaSetCheckTimeoutSec="1" Force="True" />
  </UpgradeDeployment>
</PublishProfile>

Confirm "UpgradeDeployment" tag including its child tags. This should solve the error.

Error #2 "The content in ConfigPackage Name:Config and Version:x.x.x in Service Manifest 'xxxxxxxxxxxxxxx' has changed, but the version number is the same."

You should look over - Start-ServiceFabricApplicationUpgrade (ServiceFabric) | Microsoft Docs before proceeding this post. Service Fabric applications have several versions such like Service Fabric package itself, code and config. You need to update some of the versions to upgrade Service Fabric applications.
A temporary solution is to use "Build.BuildId" for the versions. Edit ApplicationManifest.xml and ServiceManifest.xml in your Service Fabric project like below.

"your Service Fabric project name"\ApplicationPackageRoot\ApplicationManifest.xml

<?xml version="1.0" encoding="utf-8"?>
<ApplicationManifest ApplicationTypeName="SFwithASPNetAppType"
                     ApplicationTypeVersion="1.0.#{Build.BuildId}#"
                     xmlns="http://schemas.microsoft.com/2011/01/fabric"
                     xmlns:xsd="http://www.w3.org/2001/XMLSchema"
                     xmlns:xsi="http://www.w3.org/2001/XMLSchema-instance">
  <Parameters>
    <Parameter Name="GuestContainer1_InstanceCount" DefaultValue="-1" />
  </Parameters>
  <!-- Import the ServiceManifest from the ServicePackage. The ServiceManifestName and ServiceManifestVersion 
       should match the Name and Version attributes of the ServiceManifest element defined in the 
       ServiceManifest.xml file. -->
  <ServiceManifestImport>
    <ServiceManifestRef ServiceManifestName="GuestContainer1Pkg" ServiceManifestVersion="1.0.#{Build.BuildId}#" />
    <ConfigOverrides />
    <Policies>
      <ContainerHostPolicies CodePackageRef="Code" Isolation="hyperv">
    ...

"your Service Fabric project name"\ApplicationPackageRoot\"ServiceManifestName"\ServiceManifest.xml

<?xml version="1.0" encoding="utf-8"?>
<ServiceManifest Name="GuestContainer1Pkg"
                 Version="1.0.#{Build.BuildId}#"
                 xmlns="http://schemas.microsoft.com/2011/01/fabric"
                 xmlns:xsd="http://www.w3.org/2001/XMLSchema"
                 xmlns:xsi="http://www.w3.org/2001/XMLSchema-instance">
  <ServiceTypes>
    <!-- This is the name of your ServiceType.
         The UseImplicitHost attribute indicates this is a guest service. -->
    <StatelessServiceType ServiceTypeName="GuestContainer1Type" UseImplicitHost="true" />
  </ServiceTypes>

  <!-- Code package is your service executable. -->
  <CodePackage Name="Code" Version="1.0.#{Build.BuildId}#">
    <EntryPoint>
      <ContainerHost>
        <ImageName>"my container registry account ".azurecr.io/#{Build.Repository.Name}#:#{Build.BuildId}#</ImageName>
      </ContainerHost>
    </EntryPoint>
    <EnvironmentVariables>
      <EnvironmentVariable Name="VariableName" Value="VariableValue"/>
    </EnvironmentVariables>
  </CodePackage>

  <ConfigPackage Name="Config" Version="1.0.#{Build.BuildId}#" />

  <Resources>
    <Endpoints>
      <Endpoint Name="GuestContainer1TypeEndpoint" UriScheme="http" Port="xxxx" Protocol="http" />
    </Endpoints>
  </Resources>
</ServiceManifest>

You also need to follow Replace configuration files with environment variables on VSTS tasks - normalian blog to replace #{Build.BuildId}# in your xml files.

Embed Jenkins portal into Visual Studio Team Services dashboard

As you know, lots of developers are using Jenkins for their CI/CD pipeline mainly for Java and other OSS developments. But some of such developers also use Visual Studio Team Services called VSTS for .NET development. Of course, we can develop both .NET, Java and other OSS even in VSTS, but many development fields have existing Jenkins pipelines as their assets.
It's difficult to migrate their Jenkins pipeline into VSTS In such a case, but we can easily embed your Jenkins portal into VSTS dashboard. We can collaborate both VSTS and Jenkins using by such a feature. In this article, you can learn how to setup that!

Jenkins Setup - if you need

This step isn't needed if you have already setup Jenkins in your environment. Refer to contents below if you want to setup it on Microsoft Azure.

Install XFrame Filter Plugin into Jenkin and enable to use iFrame

Install a plugin called "XFrame Filter Plugin" into your Jenkins, because it needs to enable iFrame to embed your Jenkins portal into VSTS dashboard.
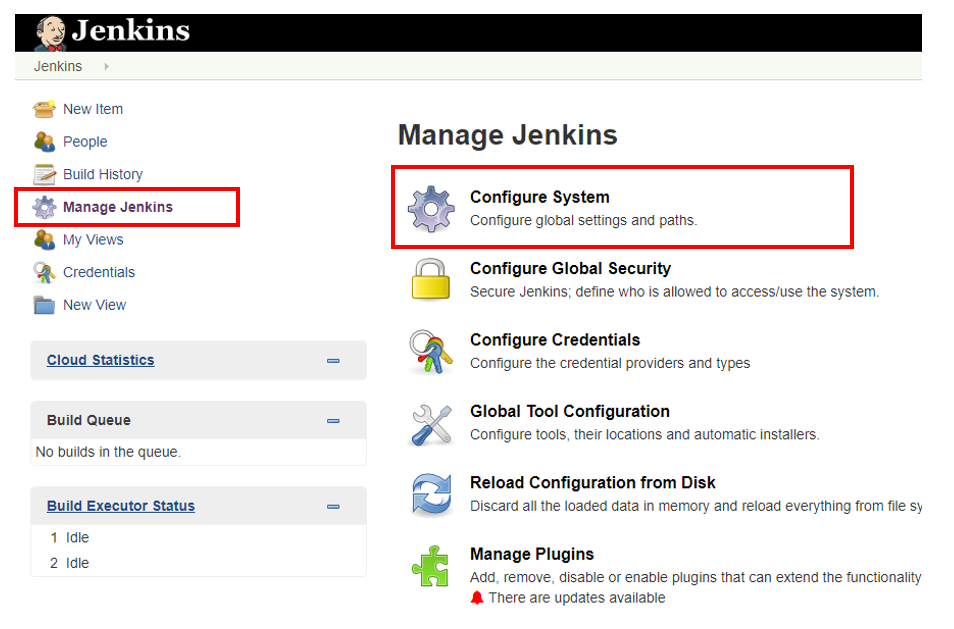
Go to your Jenkins portal and choose "Manage Jekins" - "Manage Plugins" like below.
f:id:waritohutsu:20180713224159p:plain
Next, click "Available" and input "XFrame" to find "XFrame Filter Plugin". You can install the plugin easily just enable checkbox and click "Downlaod now and install after restart".

After completion of the install, you need to configure the plugin. Go to your Jenkins portal again and choose "Manage Jekins" - "Configure System" like below.
f:id:waritohutsu:20180713224703p:plain

Find the plugin among them, enable the feature and input your VSTS account URL into "X-Frame-Options Options" box like below.
f:id:waritohutsu:20180713224949p:plain

Embed Jenkins portal using by “Embedded Webpage” into VSTS Dashboard

Next, you need to go to your VSTS dashboard and add "Embedd Webpage" like below,
f:id:waritohutsu:20180713230126p:plain
Configure "Embedd Webpage" to input your Jenkins URL like below.
f:id:waritohutsu:20180713230409p:plain

I believe your browser doesn't trust your Jenkins URL. so you also need to enable untrusted contents like below,
f:id:waritohutsu:20180713230626p:plain

Finally, you can watch Jenkins portal on VSTS dashboard, so you can watch both VSTS and Jenkins pipeline like below.
f:id:waritohutsu:20180713230803p:plain