normalian blog

Let's talk about Microsoft Azure, ASP.NET and Java!

How to get started with Reporting APIs for Enterprise customers of EA Portal

I believe some folks are familiar with Billing API for Microsoft Azure and these APIs can be utilized even you're pay-as-you-go customers. But almost of all folks are unfamiliar with "Reporting APIs for Enterprise customers", because only customers who have EA contract can utilize this APIs.
docs.microsoft.com

I recommend to refer to Azure Billing Enterprise APIs | Microsoft Docs, but here is summary what you can do with the APIs

  • Balance and Summary API - offers a monthly summary of information on balances, new purchases, Azure Marketplace service charges, adjustments and overage charges.
  • Usage Detail API - offers a daily breakdown of consumed quantities and estimated charges by an Enrollment. The result also includes information on instances, meters and departments. The API can be queried by Billing period or by a specified start and end date.
  • Marketplace Store Charge API - returns the usage-based marketplace charges breakdown by day for the specified Billing Period or start and end dates (one time fees are not included).
  • Price Sheet API - provides the applicable rate for each Meter for the given Enrollment and Billing Period.
  • Reserved Instance usage API - returns the usage of the Reserved Instance purchases. The Reserved Instance charges API shows the billing transactions made.

Preparation to use the APIs

You can utilize the APIs to pick up two items below.

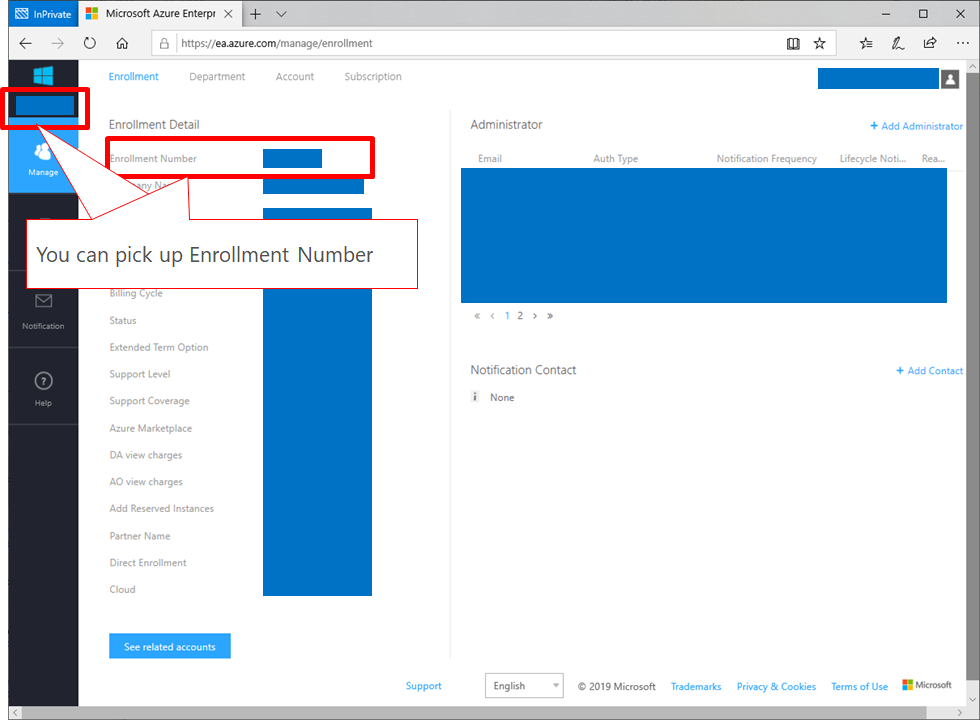
It's easy to pick up "Enrollment Number". You just need to visit EA Portal and pick up Enrollment Number like below.

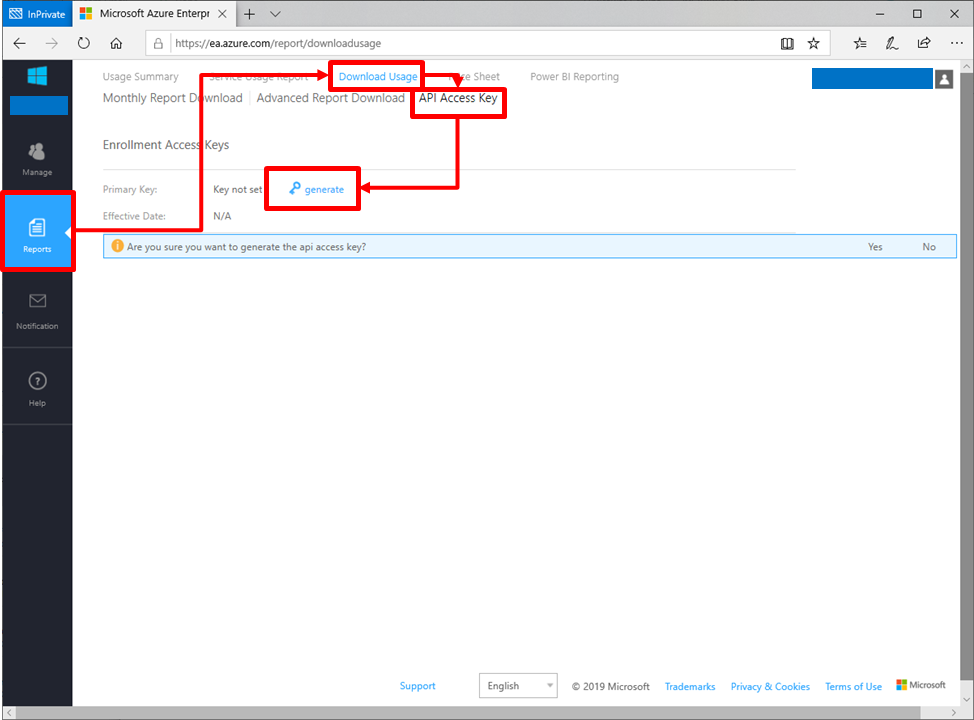
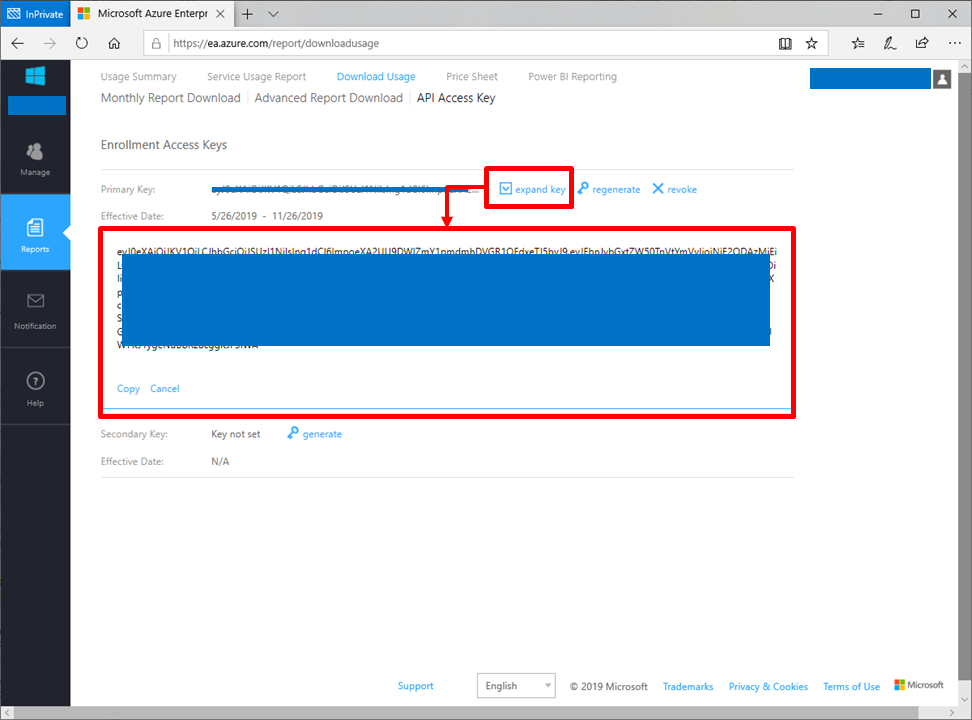
Next, follow an image below and you can generate new API Access Key.

After generating of the key, you can copy the key into your clip board.

Balance and Summary API

You can call this API easily by using script below.

$AuthorizationKey = "your API Access Key"
$enrollmentNumber = "your enrollment number"

$res = Invoke-WebRequest `
  -Headers @{"Authorization" = "bearer $AuthorizationKey"} -Method GET `
  -Uri https://consumption.azure.com/v2/enrollments/$enrollmentNumber/balancesummary `
  -ContentType "application/json"

# confirm entire response
$res

## confirm response contents
$res.Content | ConvertFrom-Json

You can confirm the response values of "$res" like below. This structure is even similar with other APIs.

StatusCode        : 200
StatusDescription : OK
Content           : {"id":"enrollments/your enrollment number/billingperiods/your billing periods/balancesummaries","billingPeriodId":"your billing periods","currencyCode":"JPY  
                    ","beginningBalance":xxxxx92.00,"endingBalance":xxxxx85.00,"newPurchases":0.00,"adju...
RawContent        : HTTP/1.1 200 OK
                    session-id: a03789eb-9b3d-49dd-8b12-c2dddb07dd62
                    x-ms-request-id: ade0cb92-3a78-4e2f-943f-b5a9bd4d8320
                    x-ms-correlation-request-id: f570130b-21b1-4bef-b1ff-d9e8a8e80e8b
                    x-ms-client...
Forms             : {}
Headers           : {[session-id, a03789eb-9b3d-49dd-8b12-c2dddb07dd62], [x-ms-request-id, ade0cb92-3a78-4e2f-943f-b5a9bd4d8320], [x-ms-correlation-request-id, 
                    f570130b-21b1-4bef-b1ff-d9e8a8e80e8b], [x-ms-client-request-id, c9d7de6c-8937-48b5-a137-3f026d637cc5]...}
Images            : {}
InputFields       : {}
Links             : {}
ParsedHtml        : mshtml.HTMLDocumentClass
RawContentLength  : 429

You can confirm the response content values of "$res.Content" like below.

id                             : enrollments/"your enrollment number"/billingperiods/"your billing periods"/balancesummaries
billingPeriodId                :  "your billing periods"
currencyCode                   : JPY  
beginningBalance               : xxxxx92.00
endingBalance                  : xxxxx85.00
newPurchases                   : 0.00
adjustments                    : 0.00
utilized                       : xxxxx7.00
serviceOverage                 : 0.00
chargesBilledSeparately        : 0.00
totalOverage                   : 0.00
totalUsage                     : xxxxx7.00
azureMarketplaceServiceCharges : 0.0000000000
newPurchasesDetails            : 
adjustmentDetails              : 

Reserved Instance usage API

You can call this API like below.

$AuthorizationKey = "your API Access Key"
$enrollmentNumber = "your enrollment number"
$startDate = "2019-05-01"
$endDate = "2019-05-10"

$res = Invoke-WebRequest `
  -Headers @{"Authorization" = "bearer $AuthorizationKey"} -Method GET `
  -Uri "https://consumption.azure.com/v2/enrollments/$enrollmentNumber/reservationdetails?startDate=$startDate&endDate=$endDate" `
  -ContentType "application/json"
$res.Content | ConvertFrom-Json

You can confirm the response content values of "$res.Content" like below.

....

reservationOrderId    : xxxxxxxx-mmmm-yyyy-nnnn-zzzzzzzzzzzz
reservationId         : xxxxxxxx-mmmm-yyyy-nnnn-zzzzzzzzzzzz
usageDate             : 2019-05-04T00:00:00
skuName               : Standard_DS1_v2
instanceId            : /subscriptions/you subscription ID/resourcegroups/your resource group/providers/microsoft.compute/virtualmachines/your vm name
totalReservedQuantity : 8.000000000000000
reservedHours         : 192.000000000000000
usedHours             : 23.950000000000000

....

reservationOrderId    : xxxxxxxx-mmmm-yyyy-nnnn-zzzzzzzzzzzz
reservationId         : xxxxxxxx-mmmm-yyyy-nnnn-zzzzzzzzzzzz
usageDate             : 2019-05-10T00:00:00
skuName               : Standard_B2s
instanceId            : /subscriptions/you subscription ID/resourcegroups/your resource group/providers/microsoft.compute/virtualmachines/your vm name
totalReservedQuantity : 1.000000000000000
reservedHours         : 24.000000000000000
usedHours             : 24.000000000000000

You can retrieve which reserved instance orders have been used up or not. In addition that, you can verify which VMs are running as Reserved Instance by checking "instanceId".

Why you can't find your new subscriptions on Azure Portal in spite of they has already been created on EA Portal?

You always need to create new Azure subscriptions on EA Portal if you have own EA contract to utilize Microsoft Azure. I have already posted an article how to get started with EA Portal like below.
normalian.hatenablog.com

It's mandatory to create your Azure subscriptions on EA Portal to charge from your monetary commitment of your EA contract. Refer to an article below which roles on EA Portal can create new Azure subscriptions.
normalian.hatenablog.com

But some folks can't find new Azure subscriptions on Azure Portal. Confirm topics below if you can't find new your subscriptions on Azure Portal.

  • Enable check of Global subscription filter for your new Azure subscription
  • Change Azure AD tenant associated with your new Azure subscription

How to create new subscriptions on EA Portal

Before describing the topics, you need to learn again how to create new subscriptions on EA Portal. Note that it's mandatory to have Account Owner role into your account like below.
f:id:waritohutsu:20190526034140p:plain
You can lunch new tab from EA Portal to create new subscription by clicking "Add Subscription" button and redirect into new page like below. Choose "Microsoft Azure Enterprise" to charge from your EA contract.
f:id:waritohutsu:20190526034222p:plain
Check two agreement terms and click "Sign up" to complete new Azure subscription.
f:id:waritohutsu:20190526034340p:plain
You will be redirected into Azure Portal like below after finishing to create the subscription but you might be not possible to find new subscription like below.
f:id:waritohutsu:20190526034517p:plain

Enable check of Global subscription filter for your new Azure subscription

Azure Portal offers "Global subscription filter" to make visible only selected subscriptions, but the new subscriptions are unchecked to visible as default.
Enable the new subscription on Global subscription filter by following like below.
f:id:waritohutsu:20190526035039p:plain

Change Azure AD tenant associated with your new Azure subscription

I believe as you know, all Azure subscriptions are associated into an Azure Active Directory tenant and have one or more subscription owners like below. In addition that, we can't list subscriptions across Azure Active Directory tenants. f:id:waritohutsu:20190526035811p:plain
This should be the cause why you can't find new Azure subscriptions even you have already enabled Global subscription filter.

New Azure subscriptions should be associated into an Azure Active Directory tenant which has your School or Work Account. It depends situations if your account is Microsoft Account. Refer to an article below if you are unfamiliar with School or Work Account and Microsoft Account.
docs.microsoft.com

Go to the new Azure subscription and choose "Change directory" like below.
f:id:waritohutsu:20190526040724p:plain

Note you need to contact Azure Active Directory tenant administrator not EA Portal administrator if you can't move the subscription into proper Azure Active Directory tenant.

What's the difference between Enterprise Administrator, Department Administrator and Account Owner on EA Portal

I believe you might be confused about how to create new Azure subscriptions just after login into EA Portal. As I have illustrated in an article below, EA Portal has some types of roles named Enterprise Administrator, Department Administrator, and Account Owner.
normalian.hatenablog.com
You need to utilize these roles properly to manage your billing and subscriptions on EA Portal.

What's can do by each role?

Here is rough description for each roles, but note that Enterprise Administrator can achieve almost everything except for creating new subscriptions and only Account Owner can do that.

  • Enterprise Administrator
    • Change EA Portal settings
    • Invite new Enterprise Administrators
    • Create new departments
    • Invite new department administrators into all departments
    • Retrieve all departments
    • Retrieve all Account Owners
    • Invite new Account Owners
    • Retrieve all subscriptions
    • Can't create new subscriptions
  • Department Administrator
    • This role is optional
    • Invite new department administrators into own departments
    • Retrieve own departments
    • Retrieve all Account Owners in own departments
    • Invite new Account Owners into own departments
    • Retrieve all subscriptions on own departments
    • Can't create new subscriptions
  • Account Owner
    • Create new subscriptions

How to invite as Enterprise Administrator

Only current Enterprise Administrator can achieve these operations. Open https://ea.azure.com and following an image below.
f:id:waritohutsu:20190524102435p:plain
A wizard will come up from right side and you can invite new Enterprise Administrator by following an image below. Please confirm "Auth Leve" if you can't find your proper Authentication Type on your EA Portal.
f:id:waritohutsu:20190524102611p:plain
New Enterprise Administrator will receive an invitation mail from your EA Portal and activate own account.

How to invite as Department Administrator

Enterprise Administrator and Department Administrator can achieve these operations. Open https://ea.azure.com and following an image below.
f:id:waritohutsu:20190524103314p:plain
These steps are almost the same with Enterprise Administrator. A wizard will come up from right side and you can invite a new Department Administrator by following an image below. Please confirm "Auth Leve" if you can't find your proper Authentication Type on your EA Portal.
f:id:waritohutsu:20190524103422p:plain

How to invite as Account Owner

Enterprise Administrator and Department Administrator can achieve these operations. Open https://ea.azure.com and following an image below.
f:id:waritohutsu:20190524104727p:plain
These steps are almost the same with Enterprise Administrator. A wizard will come up from right side and you can invite a new Department Administrator by following an image below. Please confirm "Auth Leve" if you can't find your proper Authentication Type on your EA Portal. In addtion that, you can put display name for your EA Portal.
f:id:waritohutsu:20190524104741p:plain
You can find your new Account Owner like below at pending status. It will be activated when the invited user of "Account Owner" will log in to your EA Portal.
f:id:waritohutsu:20190524104652p:plain

What's best practice for these EA Portal hierarchies?

In small organizations, it should work by utilizing only Enterprise Administrator and Account Owner. In addition that, you can hold such roles into a user account like below.
f:id:waritohutsu:20190524105436p:plain
In this diagram, xxxx01@hotmail.com can do everything on your EA Portal. You can create such accounts by following "How to invite as Enterprise Administrator" and "How to invite as Account Owner" into the same account, but consider and design proper architecture when your organization is large or users are many.

How to get started with EA Portal for Microsoft Azure

I believe most of Azure developers aren't familiar with EA Portal because only Enterprise Agreement contractor can utilize the portal. usage of this EA Portal is completely different from Azure Portal which all Azure developers are familiar like below.
f:id:waritohutsu:20190524095659p:plain

  • EA Portal is utilized to create Azure subscriptions which charge from your EA contract
  • Azure Portal is utilized to create Azure resources and consume from EA contract

As you can imagine, billing owners should use EA Portal and developers should use Azure Portal. But it sometimes difficult how to take knowledge to utilize EA Portal.

How to arrange onboarding meeting for EA Portal

Fortunately, Microsoft offers to arrange onboarding meeting with experts for EA Portal. Reach out Azure EA Portal Support and you can find a page like below.
f:id:waritohutsu:20190523094911p:plain
You can find "issue category" bottom of it. Choose "Onboarding" like below to schedule EA Portal onboarding meeting with the expert.
f:id:waritohutsu:20190523095013p:plain
After choosing them, you need to fill out some details of your status. Now, you can have a great meeting to earn deep knowledge for EA Portal. This onboarding meeting is no charge and I recommend to utilize this as possible.

How to utilize monitoring for container apps on Service Fabric clusters with Log Analytics - part 3: find CPU usage spikes

You can learn how to CPU usage spikesfrom your Log Analytics, but you need to peruse an article below to follow this post.
normalian.hatenablog.com

Prerequirement

You need to setup components below. In this post, we execute performance test to your Service Fabric cluster applications using by Application Insights.

  • Service Fabric cluster with Windows nodes
  • Log Analytics and associate to your Service Fabric cluster
  • Windows Container applications and deploy it into your Service Fabric cluster
  • Application Insights

Execute "Performance Testing" with your Application Insights

I believe as you know, Application Insights offers "Performance Testing" feature. We are no longer needed to setup multiple devices and load test applications such like JMeter.
Open your Application Insights, choose "Performance Testing" item among left side menus and click "New" item to create new performance test.
f:id:waritohutsu:20180811034948p:plain

Input an endpoint of your Service Fabric application following a picture below. Now, you can execute your performance test.
f:id:waritohutsu:20180811035207p:plain

Refer to Test your Azure web app performance under load from the Azure portal | Microsoft Docs how to setup your performance test in details.

Clarify bottlenecks of your Service Fabric applications

Watch your Log Analytics solution to confirm your Service Fabric cluster metrics in about an hour after your performance test. You probably confirm CPU usage spike on your NODE METRICS like below.
f:id:waritohutsu:20180811040548p:plain

Next, execute a query below to identify know exact time of the CPU usage spikes of NODE METRICS not container applications.

search *
| where Type == "Perf"
| where ObjectName == "Processor"
| where CounterName == "% Processor Time"
| where CounterValue > 50
| sort by TimeGenerated

f:id:waritohutsu:20180811041017p:plain

The spikes are around 8/9/2018 6:30PM in PST time zone, but you need to retrieve Log Analytics data with UTC time zone in your query even display time zone is yours. Execute query like below to retrieve all metrics around the time.

search *
| where Type == "Perf"
| where TimeGenerated >datetime(2018-08-10 1:28:00) 
| where TimeGenerated < datetime(2018-08-10 1:31:00)
| sort by TimeGenerated 

f:id:waritohutsu:20180811042635p:plain

And you can download result of the query and analyze it with Excel and other client side tools. At this time, we can find "Processor Queue Lengh" are high like below.
f:id:waritohutsu:20180811050315p:plain

You can dig into further more to use this awesome tools if you will face some performance issues.

How to utilize monitoring for container apps on Service Fabric clusters with Log Analytics - part 2: log types

Refer to an article below before following this post to setup Log Analytics for Service Fabric clusters.
normalian.hatenablog.com
You can learn how to execute simple queries on Log Analytics to retrieve Service Fabric clusters metrics.

I believe you have already setup your Service Fabric cluster with your container apps and Log Analytics. Open your Log Analytics and choose "Log Search" item. Next, execute "search *" command like below then you can take all types of logs stored into your Log Analytics.
f:id:waritohutsu:20180809081445p:plain

You can find several types of logs such like "Perf", "ContainerImageInventory", "ContainerInventory", "Heartbeat" and "Usage". According to Container Monitoring solution in Azure Log Analytics | Microsoft Docs, we can understand which metrics we can take. Next, let's dig into each log types exept for Usage, because the type is used for Log Analytics usage.

"Perf" type

In this type, you can retrieve Processor Time, Memory Usage, network usage, Disk usage including container applications.
At first, you retrieve Service Fabric cluster nodes metrics specifying ObjectName as necessary metrics like below.

search *| where Type == "Perf“
| where ObjectName == "Processor“
| where CounterName == "% Processor Time“
| where CounterValue > 25

You can find query result like below.
f:id:waritohutsu:20180809083123p:plain

next, retrieve container apps metrics on Service Fabric cluster by executing log search query below and you can retrieve container apps metrics.

search *
| where Type == "Perf“
| where ObjectName == "Container“
| where CounterName == "% Processor Time“
| where CounterValue > 2

Note the query is specified "Container“ as ObjectName and CounterName which metrics is needed.
f:id:waritohutsu:20180809083246p:plain

We can really dig into this log type in lots of perspectives. I will follow that in future.

"ContainerImageInventory" type

You can retrieve which repositories, images, tags, image sizes and nodes are used to deploy your container apps like below.
f:id:waritohutsu:20180809084040p:plain

"ContainerInventory" type

In this type, you can retrieve TimeGenerated, Computer, container name, ContainerHostname, Image, ImageTag, ContainerState, ExitCode, EnvironmentVar, Command, CreatedTime, StartedTime, FinishedTime, SourceSystem, ContainerID, and ImageID like below.
f:id:waritohutsu:20180809084656p:plain

You can monitor container apps life cycle using this log type using ContainerState, TimeGenerated, CreatedTime, StartedTime and FinishedTime like below.
f:id:waritohutsu:20180809084903p:plain

How to utilize monitoring for container apps on Service Fabric clusters with Log Analytics - part 1: setup

You can learn how to setup Log Analytics for your Windows container apps on Service Fabric clusters. You need to follow steps below.

  • Setup up Service Fabric cluster with Diagnostics "On"
  • Create an Log Analytics workspace and add "Service Fabric Analytics" into your Log Analytics workspace
  • Add "Container Monitoring Solution" into your Log Analytics workspace
  • Enable "Windows Performance Counters" in your Log Analytics workspace
  • Configure a Log Analytics workspace to associate Azure Storage stored Service Fabric logs
  • Add the OMS agent extension
  • Watch metrics on Log Analytics workspace

According to an article below, you have to setup "Service Fabric Analytics" and "Container Monitoring Solution" respectively right now. It will be integrated in future.

Setup up Service Fabric cluster with Diagnostics "On"

Refer to an article below.
normalian.hatenablog.com
And keep in mind that you should enable "Diagnostics" as "On" like below.
f:id:waritohutsu:20180802120914p:plain

Create an Log Analytics workspace and add "Service Fabric Analytics" into your Log Analytics workspace

It's needed to monitor Service Fabric container apps by creating "Service Fabric Analytics". Search "service fabric" in Marketpalce on Azure Portal like below.
f:id:waritohutsu:20180802120931p:plain
And create Log Analytics workspace and "Service Fabric Analytics" like below.
f:id:waritohutsu:20180802120948p:plain

Add "Container Monitoring Solution" into your Log Analytics workspace

Search "Container Monitor" in Marketpalce on Azure Portal and find "Container Monitoring Solution" like below.
f:id:waritohutsu:20180802121755p:plain
Create "Container Monitoring Solution" into your Log Analytics workspace.

Enable "Windows Performance Counters" in your Log Analytics workspace

After completion to create Log Analytics workspace, go to "Advanced setting -> Data -> Windows Performance Counters" and enable like below.
f:id:waritohutsu:20180802120959p:plain
Don't forget to click "Save" after changing settings of your workspace.

Configure a Log Analytics workspace to associate Azure Storage stored Service Fabric logs

Refer to Assess Service Fabric applications with Azure Log Analytics using PowerShell | Microsoft Docs and execute "Configure Log Analytics to collect and view Service Fabric logs
" PowerShell scripts interactively.
You can find two Azure Storage accounts in your Log Analytics workspace like below.
f:id:waritohutsu:20180802121529p:plain

Add the OMS agent extension

At first, go to your Log Analytics workspace, choose "Advanced settings -> Connected Sources -> Windows Servers" and pick up “WORKSPACE ID” and “PRIMARY KEY” like below.
f:id:waritohutsu:20180802122345p:plain
After that, execute Azure-cli comand below to add oms agent into your VMSS of Service Fabric cluster.

az vmss extension set --name MicrosoftMonitoringAgent --publisher Microsoft.EnterpriseCloud.Monitoring --resource-group <nameOfResourceGroup> --vmss-name <nameOfNodeType> --settings "{'workspaceId':'<Log AnalyticsworkspaceId>'}" --protected-settings "{'workspaceKey':'<Log AnalyticsworkspaceKey>'}"

You can confirm to find three extensions by executing PowerShell commands like below.

PS C:\Users\warit> $resourceGroupName = "your resource group name"
PS C:\Users\warit> $resourceName ="your node type name and it equals to your VMSS name"
PS C:\Users\warit> $virtualMachineScaleSet = Get-AzureRmVmss -ResourceGroupName $resourceGroupName -VMScaleSetName $resourceName
PS C:\Users\warit> $virtualMachineScaleSet.VirtualMachineProfile.ExtensionProfile.Extensions

Name                    : nodetype_ServiceFabricNode
ForceUpdateTag          : 
Publisher               : Microsoft.Azure.ServiceFabric
Type                    : ServiceFabricNode
TypeHandlerVersion      : 1.0
AutoUpgradeMinorVersion : True
Settings                : {clusterEndpoint, nodeTypeRef, dataPath, durabilityLevel...}
ProtectedSettings       : 
ProvisioningState       : 
Id                      : 

Name                    : VMDiagnosticsVmExt_vmNodeType0Name
ForceUpdateTag          : 
Publisher               : Microsoft.Azure.Diagnostics
Type                    : IaaSDiagnostics
TypeHandlerVersion      : 1.5
AutoUpgradeMinorVersion : True
Settings                : {WadCfg, StorageAccount}
ProtectedSettings       : 
ProvisioningState       : 
Id                      : 

Name                    : MicrosoftMonitoringAgent
ForceUpdateTag          : 
Publisher               : Microsoft.EnterpriseCloud.Monitoring
Type                    : MicrosoftMonitoringAgent
TypeHandlerVersion      : 1.0
AutoUpgradeMinorVersion : True
Settings                : {workspaceId}
ProtectedSettings       : 
ProvisioningState       : 
Id                      : 

Watch metrics on Log Analytics workspace

You should wait about 10 minutes or later to store metrics into your Log Analytics workspace. Go to "workspace summary" on your Log Analytics workspace and you can find two items like below.
f:id:waritohutsu:20180802124054p:plain
Choose "Service Fabric" and you can find CPU/Memory/Disk usage both host nodes and container metrics like below.
f:id:waritohutsu:20180802124216p:plain