How to utilize monitoring for container apps on Service Fabric clusters with Log Analytics - part 3: find CPU usage spikes
You can learn how to CPU usage spikesfrom your Log Analytics, but you need to peruse an article below to follow this post.
normalian.hatenablog.com
Prerequirement
You need to setup components below. In this post, we execute performance test to your Service Fabric cluster applications using by Application Insights.
Execute "Performance Testing" with your Application Insights
I believe as you know, Application Insights offers "Performance Testing" feature. We are no longer needed to setup multiple devices and load test applications such like JMeter.
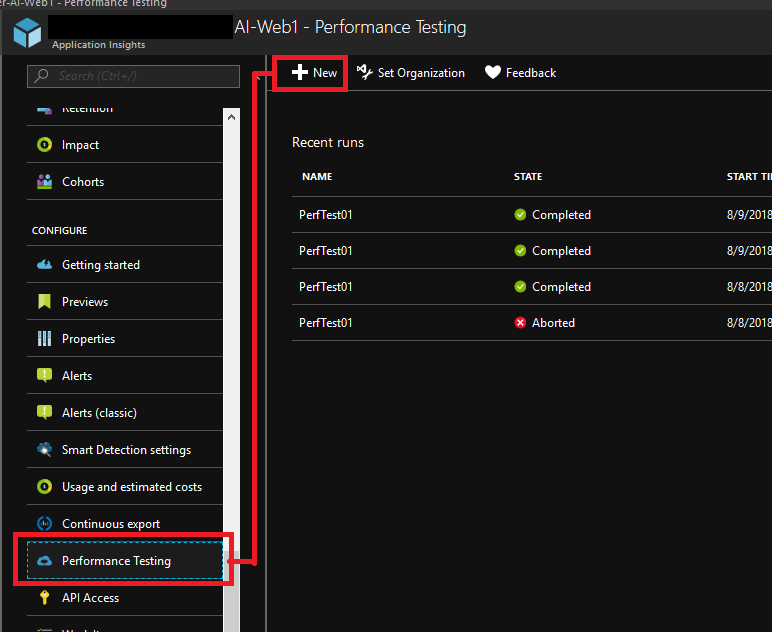
Open your Application Insights, choose "Performance Testing" item among left side menus and click "New" item to create new performance test.
Input an endpoint of your Service Fabric application following a picture below. Now, you can execute your performance test.
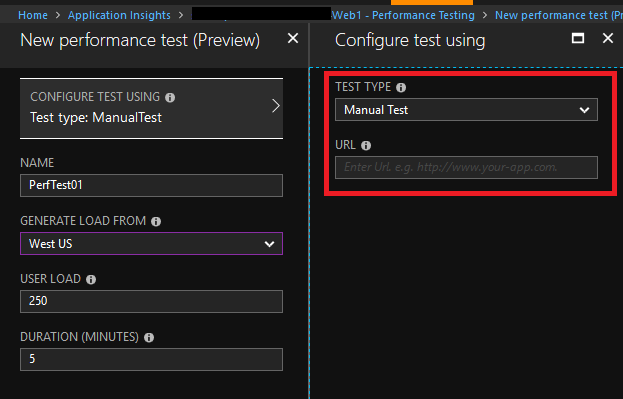
Refer to Test your Azure web app performance under load from the Azure portal | Microsoft Docs how to setup your performance test in details.
Clarify bottlenecks of your Service Fabric applications
Watch your Log Analytics solution to confirm your Service Fabric cluster metrics in about an hour after your performance test. You probably confirm CPU usage spike on your NODE METRICS like below.
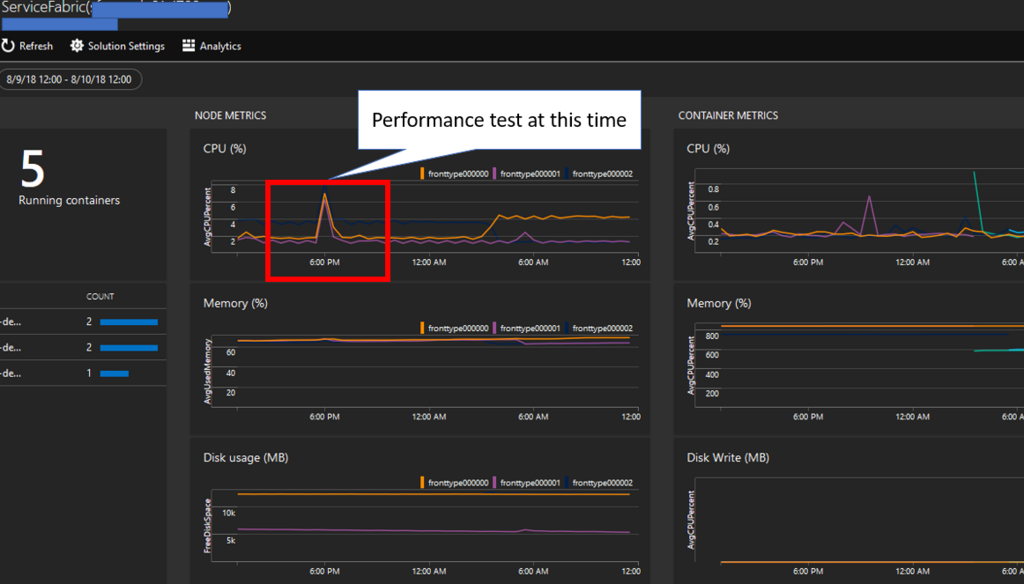
Next, execute a query below to identify know exact time of the CPU usage spikes of NODE METRICS not container applications.
search *
| where Type == "Perf"
| where ObjectName == "Processor"
| where CounterName == "% Processor Time"
| where CounterValue > 50
| sort by TimeGenerated
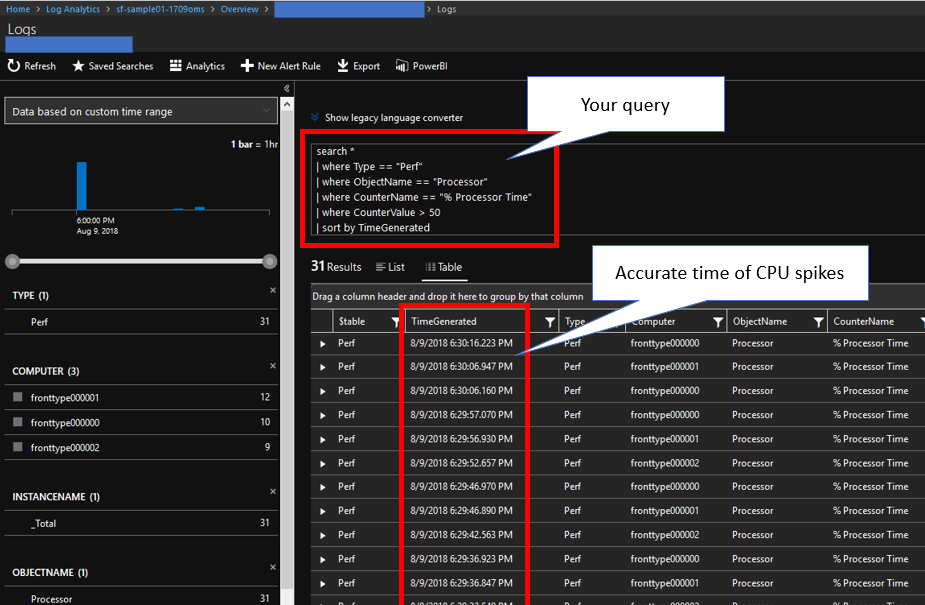
The spikes are around 8/9/2018 6:30PM in PST time zone, but you need to retrieve Log Analytics data with UTC time zone in your query even display time zone is yours. Execute query like below to retrieve all metrics around the time.
search *
| where Type == "Perf"
| where TimeGenerated >datetime(2018-08-10 1:28:00)
| where TimeGenerated < datetime(2018-08-10 1:31:00)
| sort by TimeGenerated
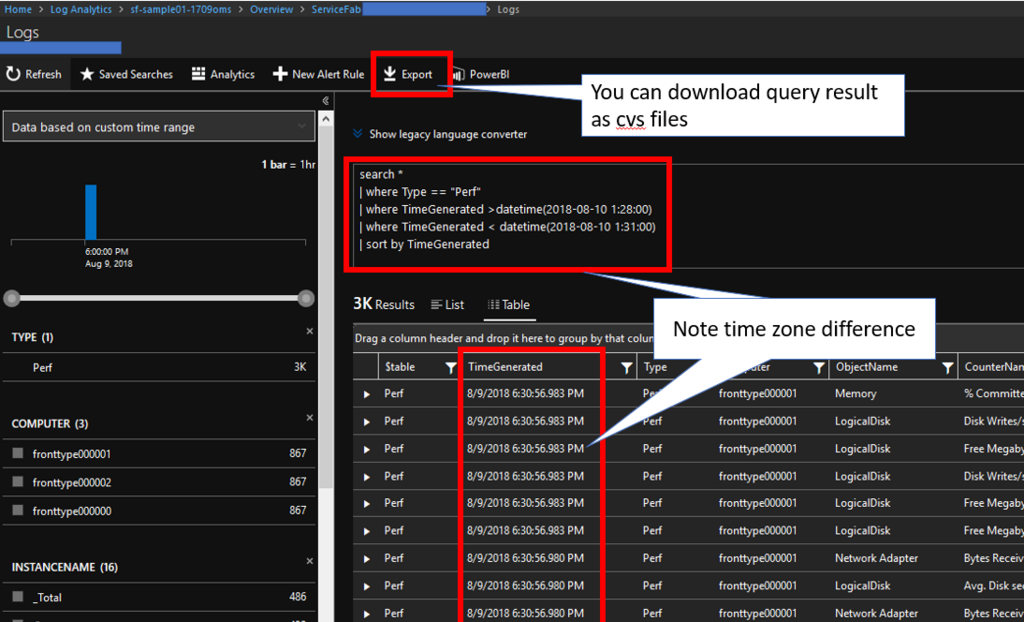
And you can download result of the query and analyze it with Excel and other client side tools. At this time, we can find "Processor Queue Lengh" are high like below.
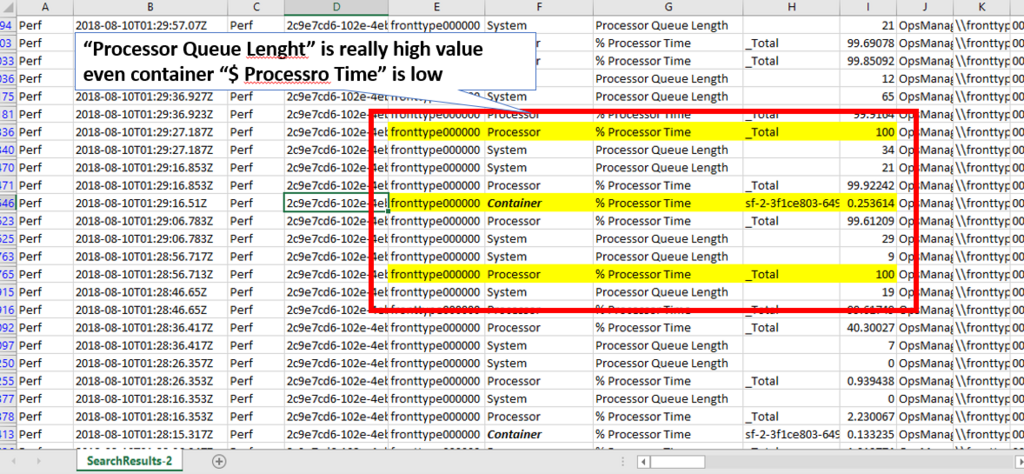
You can dig into further more to use this awesome tools if you will face some performance issues.