How to utilize monitoring for container apps on Service Fabric clusters with Log Analytics - part 1: setup
You can learn how to setup Log Analytics for your Windows container apps on Service Fabric clusters. You need to follow steps below.
- Setup up Service Fabric cluster with Diagnostics "On"
- Create an Log Analytics workspace and add "Service Fabric Analytics" into your Log Analytics workspace
- Add "Container Monitoring Solution" into your Log Analytics workspace
- Enable "Windows Performance Counters" in your Log Analytics workspace
- Configure a Log Analytics workspace to associate Azure Storage stored Service Fabric logs
- Add the OMS agent extension
- Watch metrics on Log Analytics workspace
According to an article below, you have to setup "Service Fabric Analytics" and "Container Monitoring Solution" respectively right now. It will be integrated in future.
Setup up Service Fabric cluster with Diagnostics "On"
Refer to an article below.
normalian.hatenablog.com
And keep in mind that you should enable "Diagnostics" as "On" like below.

Create an Log Analytics workspace and add "Service Fabric Analytics" into your Log Analytics workspace
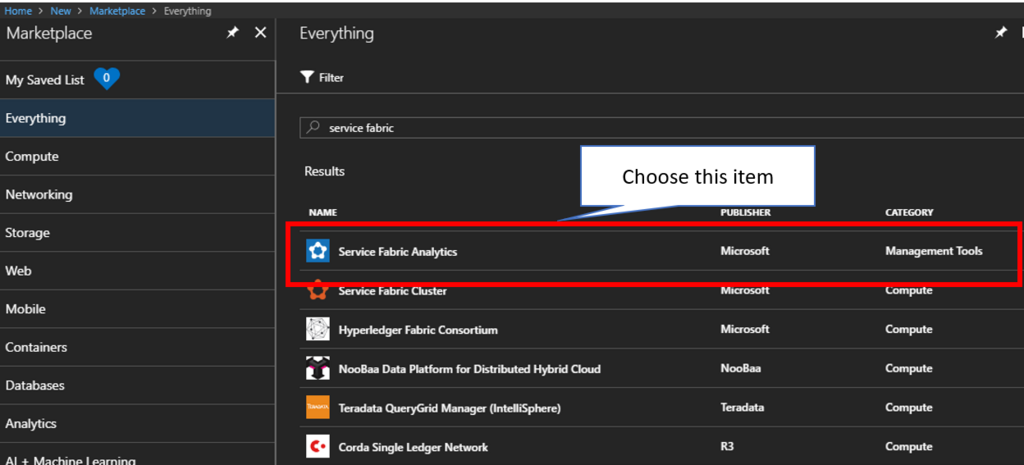
It's needed to monitor Service Fabric container apps by creating "Service Fabric Analytics". Search "service fabric" in Marketpalce on Azure Portal like below.
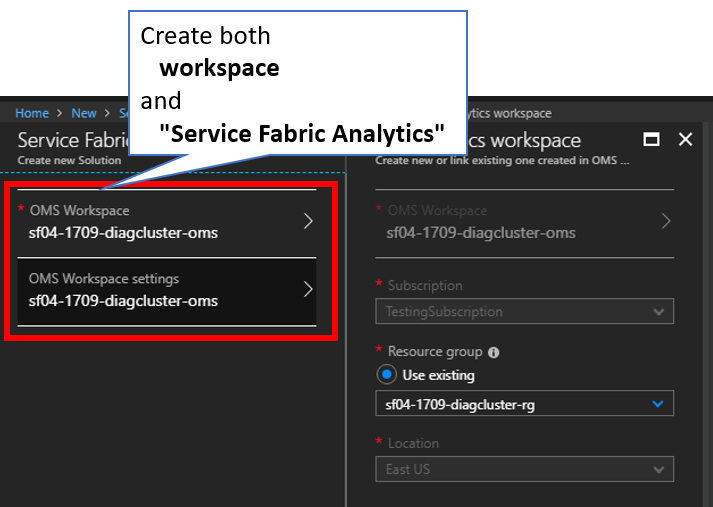
And create Log Analytics workspace and "Service Fabric Analytics" like below.
Add "Container Monitoring Solution" into your Log Analytics workspace
Search "Container Monitor" in Marketpalce on Azure Portal and find "Container Monitoring Solution" like below.
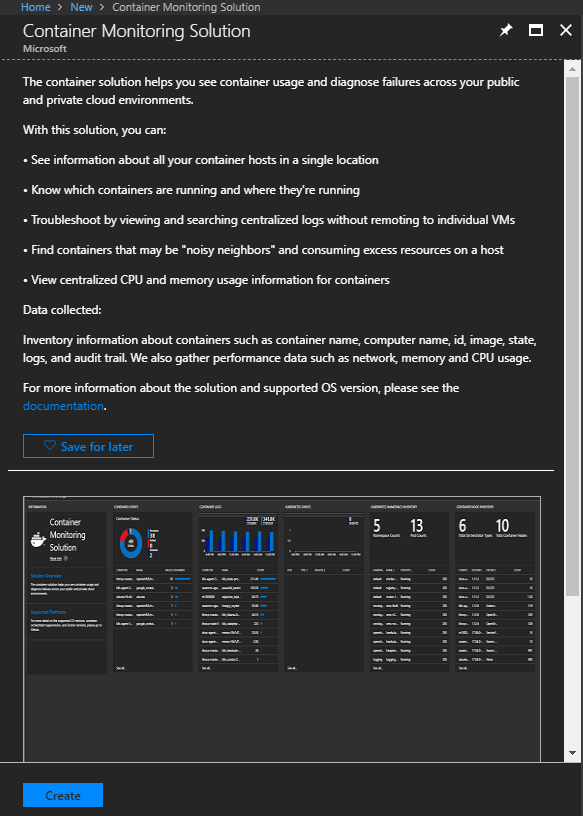
Create "Container Monitoring Solution" into your Log Analytics workspace.
Enable "Windows Performance Counters" in your Log Analytics workspace
After completion to create Log Analytics workspace, go to "Advanced setting -> Data -> Windows Performance Counters" and enable like below.
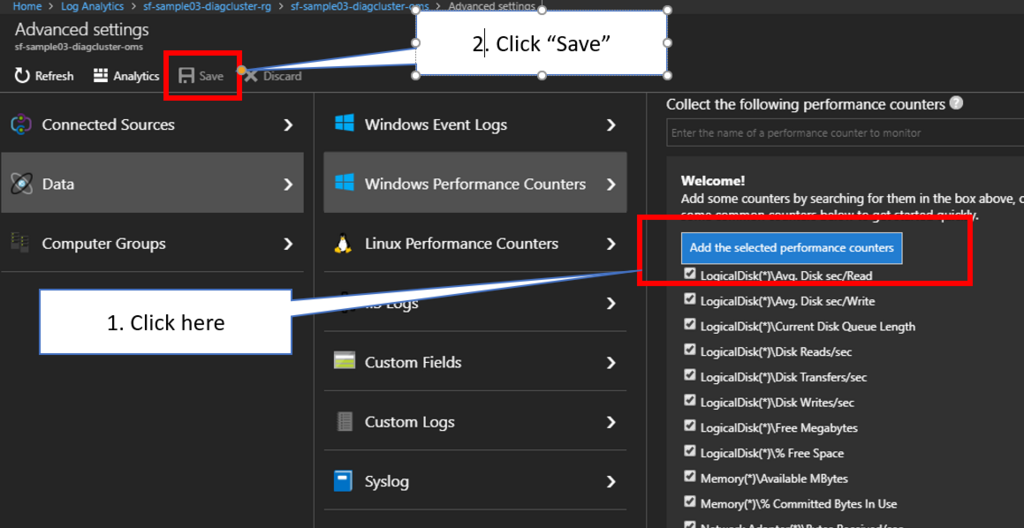
Don't forget to click "Save" after changing settings of your workspace.
Configure a Log Analytics workspace to associate Azure Storage stored Service Fabric logs
Refer to Assess Service Fabric applications with Azure Log Analytics using PowerShell | Microsoft Docs and execute "Configure Log Analytics to collect and view Service Fabric logs
" PowerShell scripts interactively.
You can find two Azure Storage accounts in your Log Analytics workspace like below.

Add the OMS agent extension
At first, go to your Log Analytics workspace, choose "Advanced settings -> Connected Sources -> Windows Servers" and pick up “WORKSPACE ID” and “PRIMARY KEY” like below.

After that, execute Azure-cli comand below to add oms agent into your VMSS of Service Fabric cluster.
az vmss extension set --name MicrosoftMonitoringAgent --publisher Microsoft.EnterpriseCloud.Monitoring --resource-group <nameOfResourceGroup> --vmss-name <nameOfNodeType> --settings "{'workspaceId':'<Log AnalyticsworkspaceId>'}" --protected-settings "{'workspaceKey':'<Log AnalyticsworkspaceKey>'}"You can confirm to find three extensions by executing PowerShell commands like below.
PS C:\Users\warit> $resourceGroupName = "your resource group name"
PS C:\Users\warit> $resourceName ="your node type name and it equals to your VMSS name"
PS C:\Users\warit> $virtualMachineScaleSet = Get-AzureRmVmss -ResourceGroupName $resourceGroupName -VMScaleSetName $resourceName
PS C:\Users\warit> $virtualMachineScaleSet.VirtualMachineProfile.ExtensionProfile.Extensions

Name                    : nodetype_ServiceFabricNode
ForceUpdateTag          :
Publisher               : Microsoft.Azure.ServiceFabric
Type                    : ServiceFabricNode
TypeHandlerVersion      : 1.0
AutoUpgradeMinorVersion : True
Settings                : {clusterEndpoint, nodeTypeRef, dataPath, durabilityLevel...}
ProtectedSettings       :
ProvisioningState       :
Id                      :

Name                    : VMDiagnosticsVmExt_vmNodeType0Name
ForceUpdateTag          :
Publisher               : Microsoft.Azure.Diagnostics
Type                    : IaaSDiagnostics
TypeHandlerVersion      : 1.5
AutoUpgradeMinorVersion : True
Settings                : {WadCfg, StorageAccount}
ProtectedSettings       :
ProvisioningState       :
Id                      :

Name                    : MicrosoftMonitoringAgent
ForceUpdateTag          :
Publisher               : Microsoft.EnterpriseCloud.Monitoring
Type                    : MicrosoftMonitoringAgent
TypeHandlerVersion      : 1.0
AutoUpgradeMinorVersion : True
Settings                : {workspaceId}
ProtectedSettings       :
ProvisioningState       :
Id                      :
Watch metrics on Log Analytics workspace
You should wait about 10 minutes or later to store metrics into your Log Analytics workspace. Go to "workspace summary" on your Log Analytics workspace and you can find two items like below.
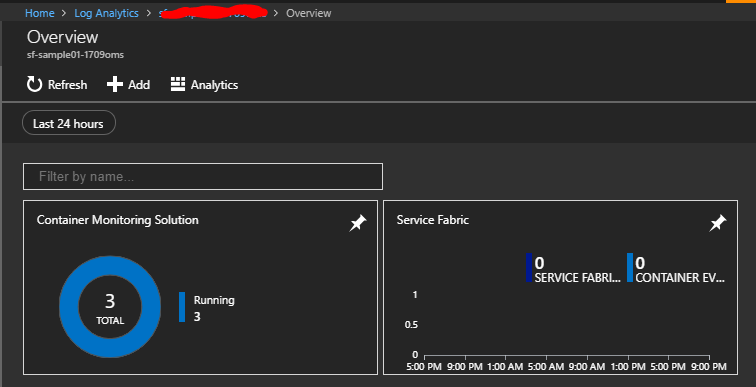
Choose "Service Fabric" and you can find CPU/Memory/Disk usage both host nodes and container metrics like below.
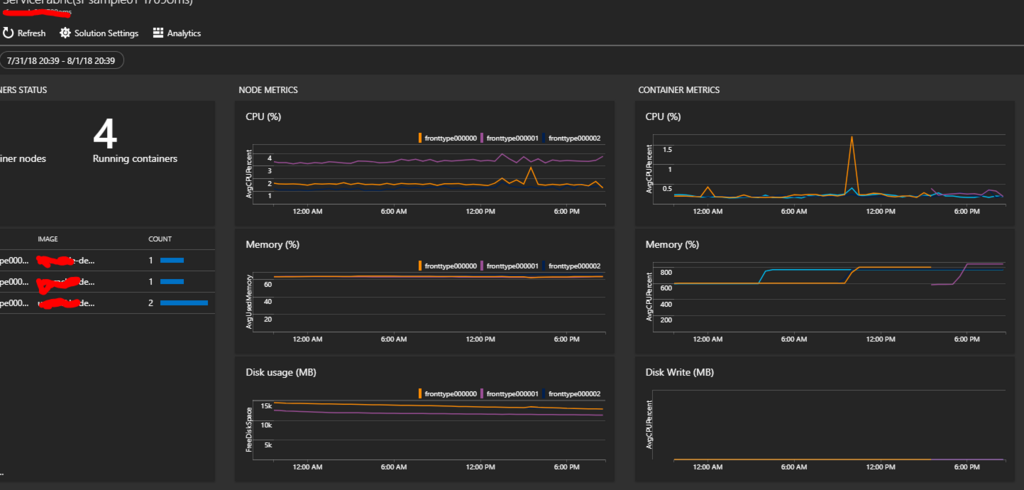
References
- Performance Monitoring with Log Analytics https://docs.microsoft.com/en-us/azure/service-fabric/service-fabric-diagnostics-oms-agent#add-the-agent-extension-via-azure-cli
- Assess Azure Service Fabric applications and micro-services with PowerShell https://docs.microsoft.com/en-us/azure/log-analytics/log-analytics-service-fabric#configure-log-analytics-to-collect-and-view-service-fabric-logs
- Event aggregation and collection using Windows Azure Diagnostics Event aggregation and collection using Windows Azure Diagnostics https://docs.microsoft.com/en-us/azure/service-fabric/service-fabric-diagnostics-event-aggregation-wad